|
Many math students do not have confidence when doing math and have negative feelings regarding the entire topic of mathematics. Learners attitudes about math affect their confidence and motivation when studying mathematics. It is important for math instructors to know how their students feel about math.
To determine learner attitudes, a survey can be administered both at the beginning, and again at the end, of a term or year to gauge attitudes. Comparing these two surveys will also show any changes in attitudes that may have occurred over the course. This survey is being given near the end of the term, and so is just a trial run to help create a useful tool for administering a survey at the beginning and end of next term. Surveys can help gauge emotional and supportive measures needed to help students develop both proficiency and an appreciation of math, reversing their negative feelings. I plan to create and administer a survey to math students who attend a vocational high school. The vocations introduced at this school are: architecture, construction, and engineering. Twenty-five students of mixed ages, races, and family incomes will answer the survey questions using a 5-point Likert scale rating from “Definitely True About Me” to “Definitely Not True About Me.” I met with stakeholders – an administrator and a math instructor – to determine their needs and using the survey will help to determine the needs of the students. After the 25 student surveys have been completed, I will use the data to draw conclusions regarding student attitudes about mathematics. I will then give this information to the instructor who can then adjust their instructional methods and environment to help improve learner outcomes, as needed. My goal is to learn how to determine what student feelings are concerning math in general and to discover ways to change negative feelings and experiences into positive ones. Along with the results of the survey, I would like to present to the teachers some suggestions for creating student interest in math:
I would also like to compare math students from this particular school against averages from other surveys to determine whether the students at this school have better, worse, or equal attitudes. I believe that the math students in this school have more positive attitudes about mathematics than students in a non-vocational school because they are given many real-life applications of math which I think this improves their attitudes. I was able to incorporate several of the strategies described in the class materials. I zig-zagged when I had to adjust the problem that I was working on when I found that the issue was not what I originally thought it was (Sawyer, 2013, p. 214). I used the “Third Practice of Making: Build It” (Sawyer, 2013, pp. 207-208) to create a “Quick and Dirty” set of survey questions, entering them into Survey Monkey, an application, and creating a “prototype.” I used the “First Practice of Choosing: Know What You Are Looking For: Train Your Intuition” by pre-making the survey and doing research in preparation for my meeting. The “First Practice of Looking: Use Fresh Eyes: Look for Serendipity” happened when I realized that the survey was what was needed before I knew what the needs of the stakeholders were. Having that work out perfectly was a “happy accident.” I also used the “Switch Perspectives” technique from this same chapter to look at this problem from many perspectives – students, instructors, and administrators (Sawyer, 2013, pp. 85-88). Sawyer, R. K. (2013). Zig Zag: The Surprising Path to Greater Creativity. San Francisco, CA: Jossey-Bass. Retrieved 2018 My goal was to try to learn how to improve the experiences and attitudes of math students. I discovered that there are many steps to doing this. I needed to do research into how students feel about math, how to gauge their feelings, and possible ways to improve student attitudes about mathematics. I worked with research material to locate sample survey questions, I used Survey Monkey and then Excel to design the survey and Excel to work with the data. I also had an assistant, my daughter who helped me to develop the survey questions and to compile the data. I felt a great deal of time pressure. First, I had issues coming up with a problem to solve and then I had to wait to meet with the stakeholders, and then wait again for the surveys to be administered. Very nerve-wracking. I am inspired to learn more about ways to help learners enjoy math and build confidence with problem-solving because I love math and I want other to as well. The biggest challenge that I faced was coming up with a problem to solve, but I experienced another when I picked up the completed surveys. Somehow the instructor used my original “quick and dirty” list of questions, not the fine-tuned ones. This was challenging because questions that were slightly the same were too close together in the survey and many were framed negatively. The “new and improved” version was more accurate and had a better visual quality, with less questions. I had pared down the 100 questions from the original survey to 80 questions on the final one. I think that many of the students were put off by the number of questions and their repetitiveness and did not answer seriously. Even if this is not a fact, I feel that the survey was a failure because of this. I have reached my goal of having created a survey, administering it, and getting results, but I think that to be thorough and accurate, I would like to survey a larger number of students and use the corrected list of questions. Learning even more information from the instructors about what they have experienced would be interesting and valuable to the finished product. I have not yet completed analyzing the data gathered from the survey, but plan to have some basic charts ready for my final presentation. Plus, I would like to start over with the correct survey even if I am not sure that it is better that the one I ended up using. 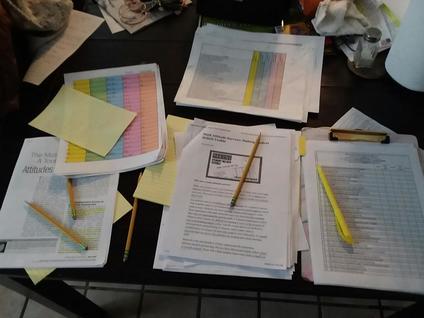
This is what my desk looked like while I was working with the survey data...
Here is a video that shows “The Map of Mathematics” and gives some idea
of how much math there is and what each specialty focuses. I hope you find it as interesting as I did…
Reference
Sawyer, R. K. (2013). Zig Zag: The Surprising Path to Greater Creativity. San Francisco, CA: Jossey-Bass. Retrieved 2018
0 Comments
The beginning of this process was very difficult for me. I had lots of ideas, but none that I had “influence” over and I struggled to find a workable real-life problem. Thanks to Professor Svihla’s suggestions, I have a project that interests me and that I have influence over. My original hypothesis was that students are not confident or comfortable doing math problems, and vocational education instructors need real-life math problems that are related to trades work. I went to the school twice – once just to get a feel for the school and the students, and the second time to meet with two faculty members. During my initial visit I learned that creating math problems related to the trades was not the actual issue. The actual problem is that many math students do not have confidence when doing math and have negative feelings regarding the entire topic of mathematics. What could be done to change this reaction among math students? How can they learn to appreciate math and to see its application in the real world? I felt some pressure because of the inability to meet with the instructors right away so that I could get started immediately. This is why I investigated possible problems associated with mathematics education. I filled the two weeks between the two meetings by doing some research about student math attitudes. I found a lot of data regarding the negative ways that many students feel about math and the practice of using surveys to gauge emotional and supportive measures needed to help students develop both proficiency and an appreciation of math, reversing the negative feelings. I created a survey of my own using samples that I found online. I then used an app called Survey Monkey and entered 100 questions. I discovered that I would have to subscribe to the service to use a survey with more than ten questions. So, I copied the questions into Excel and formatted the survey to make it easy to complete. My daughter then helped me reword and edit the list of survey questions, ending up with about 85. 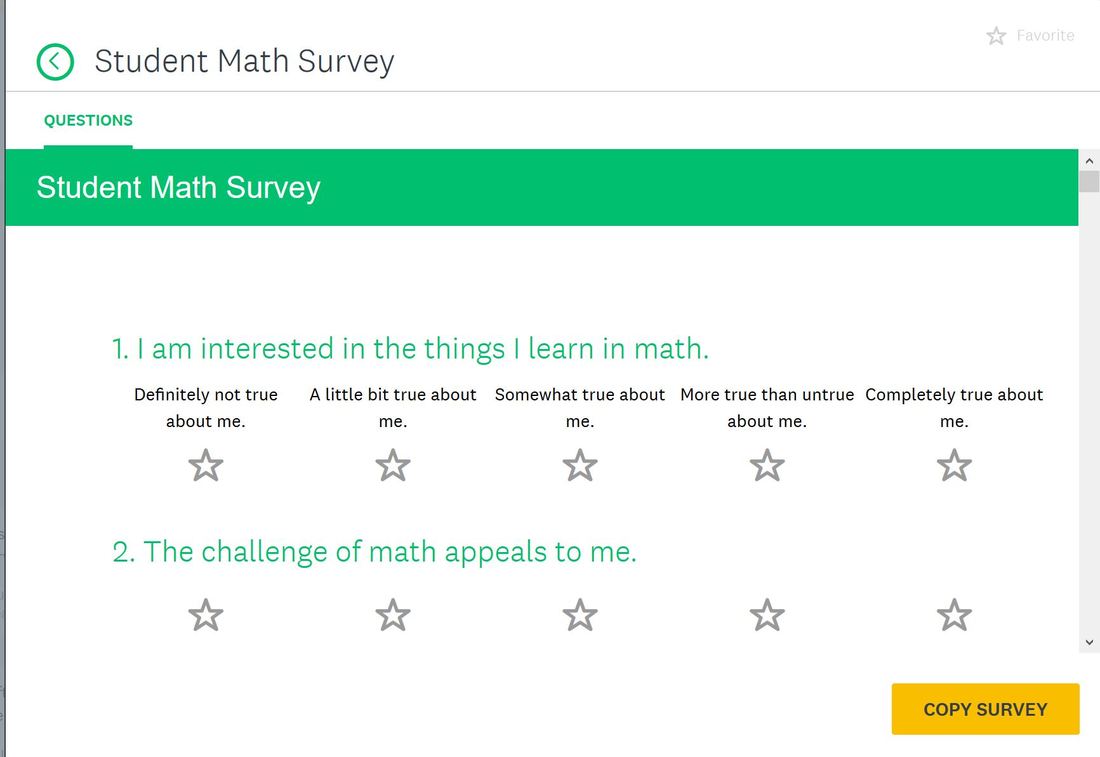
This is what the survey looked like in Survey Monkey. I originally thought to use a star rating for this questionnaire because younger students use ratings with social media and it would be a familiar method.
I returned to the school last week and was able to meet with a transition coach and a math instructor. We discussed how the math instructors incorporate math into real life situations and projects. This school uses math in ways that are reflective of real life situations, are hands on, and are within each student’s math abilities, all of which create confidence and mathematical ability. But there are still those students who could benefit from even more intervention emotionally towards math. I suggested using a survey to get more answers. My suggestion was well received, and after making a few more adjustments, I gave them the survey file which they will have their students complete next week. 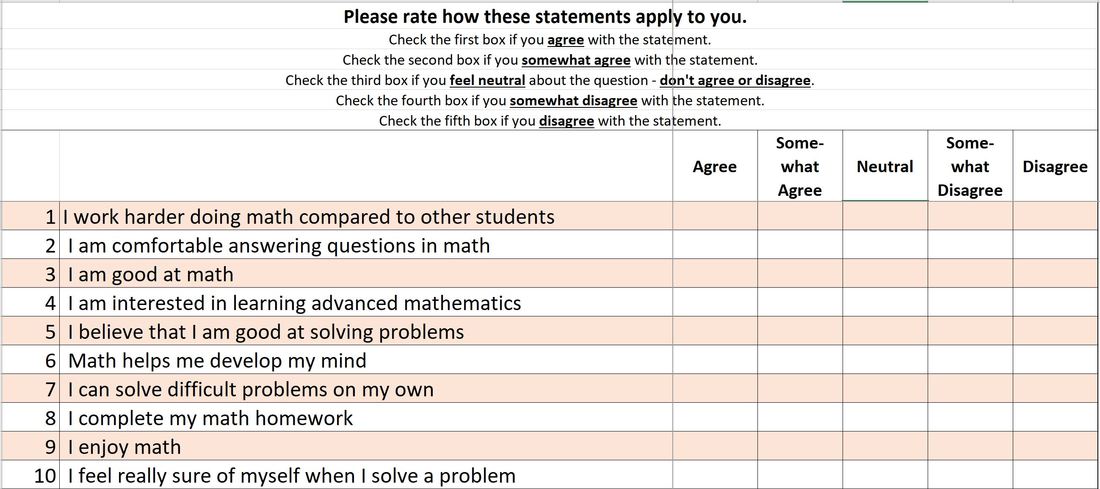
This is the survey that I created. If you would like to take the survey, here is a link:
If you want to submit to me for my research, my email is [email protected]. I will happily add it to my future research into how to help students learn to enjoy math.
Here is a brief conversation concerning how this school uses math... |
|||
